Wednesday, December 13, 2023

Visualization – Santa Style

I have worked for years on data visualization with organizations making sure that key metrics stood out for executives and decision makers.  This is something I thought I perfected through education and training.

In reality, I learned the importance of visualization from a blue-collar worker over 50 years ago.  Every Christmas Eve Santa would wrap all our presents and put them neatly under the tree.  As I grew up, Daddy took over this role and he would wrap presents, in the evenings, and put them under the tree.  The next morning, I would wake up to beautifully wrapped presents.

Fast forward to 2023, I find myself wrapping and strategically placing the presents under the tree so that the key people in my family eyes are drawn to their presents.  My husband ask how many times I was going to rearrange the presents, because each time I add a present, it required me to rearrange them all.

I put key visualizations on the most important presents and place them in the front of all the others.  Now what key visualizations can you use to attract attention?

  • For babies, put shiny bells on the presents

  • 3 – 8 years put a toy on the present

  • 8 – 12 years old, wrap in glitter (glitter fights are so fun)

Last year, my 14-year-old asked for makeup for Christmas. That present got decorated with makeup brushes. This caused questions from the aunts, "Whose present has the makeup brushes?" No one appreciated the answer.


So now how do I decide which presents be the most prominent under the tree? For my house it is easy:  Any presents that are signed –  "Love, Grams and Grandpa."


Happy Holidays to all!

Thursday, July 6, 2023

Oracle Database 23c Free - Feature Highlights

In an effort to give developers a head start with the new features coming out in the database 23c release, Oracle recently released Oracle Database 23c Free.  A virtual image with a copy of the database is available for download from Oracle's website.  Included in in the virtual image are the following:

  • Oracle Linux 8.7
  • Oracle Database 23.2 Free - Developer Release for Linux x86-6
  • Oracle REST Data Services 23.1
  • Oracle SQLcl 23.1
  • Oracle APEX 22.2
  • Schema with sample data
The database is limited to 12GB of user data storage and maximum RAM is 2GB. While this sufficient space and memory to test out the new database features, it is not intended for production applications. 

In less than an hour from starting the download, I was working in the new 23c instance.  Most of  the examples are from the HR sample schema provided by Oracle.  

Starting with the important question first:  When is Oracle Database 23c going to be released?

If you ask when when the Oracle database 23c is going to be released,  you will get a different vague answer depending whether you are a cloud or on-prem customer and who you ask. I am thinking it will be released around calendar year-end or maybe early next year.  For those on in the cloud, your migration schedule will follow the release date.

This blog will cover a few features that developers will appreciate.  The goal is to provide follow-up blogs over the next several months with additional feature highlights. 

Domains
Domains are a single point of definition for columns.  This will allow the developer to define a column domain and use it through out the database application.  Below is an example that can be found in several places on the internet.  This example is from a blog on Oracle's website written by Ulrike Schwinn, Distinguished Data Management Expert.  

Creating Domain

create domain if not exists myemail_domain AS VARCHAR2(100)
default on null 'XXXX' || '@missingmail.com'
constraint email_c CHECK (regexp_like (myemail_domain, '^(\S+)\@(\S+)\.(\S+)$'))
display substr(myemail_domain, instr(myemail_domain, '@') + 1);

create table person
     ( p_id number(5),
       p_name varchar2(50),
       p_sal number,
       p_email varchar2(100) domain myemail_domain
      );


This will help with column definition consistency throughout your database application.  To learn more about domains, I recommend reading Ulrike's detailed blog.  

GROUP BY and HAVING Clause with Column Aliases
Starting with the 23c release, the GROUP BY and HAVING clause will be able to use column aliases. No more need to to re-enter long column calculations.  Below is an example using the sample schema data that Oracle provided.


Outlined in red  are the GROUP BY and HAVING clauses using the aliases. In the example above, the column formulas aren't too complicated but what if we had a nested case statement or complex calculation?  

GROUP BY with Column Position
Just like in the ORDER BY clause,  we will be able to use column positions in the GROUP BY clause.   Below is an example of a simply GROUP BY using the column position.


Notice the ALTER SESSION statement just above the SELECT statement.  The group_by_position_enabled variable is set to 'false' by default.  It must be set to 'true' at the system level or for the current session to take advantage of the GROUP BY column position feature.  


SELECT without FROM Clause
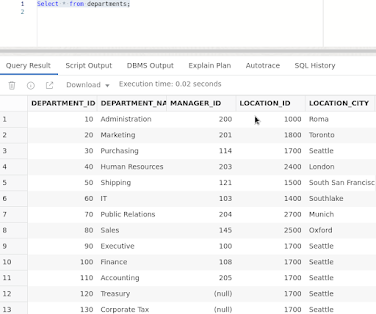
You can now run SELECT expression-only queries without a FROM clause.  No more FROM dual is needed.  If  a “;” is placed at the end, a red dot and squiggly line appear, indicating incorrect code, but the statement runs fine.


Direct Joins for UPDATE and DELETE Statements
Starting with Oracle database 23c onward,  we are allowed to use direct joins to tables to drive UPDATE and DELETE statements. Below is an example using the HR schema provided by Oracle. A new column, department_name, was created in the EMPLOYEES table.  This column was added to easily demonstrate this new feature. 

EMPLOYEES table after adding department_name column:


DEPARTMENTS table


EMPLOYEES table after running the simple UPDATE command below:


This feature will simplify coding for UPDATES and DELETES.


Oracle has 300 plus new features, some that worth spending some tine to explore are:

  • New Graph SQL standard (Don't have to know PGQL)
  • JSON support
  • SQL Transpiler  (allows functions to be converted to SQL for better performance)
  • Temporary Access/Privileges
  • New Developer Role
  • Efficient Table DDL Change Notification
  • Better Return Clauses (provides old and new values when applicable)
  • If [NOT] EXISTS Syntax Support
  • DEFAULT ON NULL for UPDATE and INSERT Statements
  • Aggregation over INTERVAL datatypes
  • Boolean Data Types

I hope you find these features as helpful as I have.  Enjoy and happy coding.  


Friday, June 2, 2023

Taking Advantage of Oracle Analytics Data Visualizations in Classic Dashboards


Many companies are still using Oracle Analytics Classic Dashboards and Answers (Classic) but would like to take advantage of some of the new visualizations that are available in Oracle Analytics Data Visualization (DV).  This can be easily accomplished by creating a visualization in DV an adding it to a dashboard page in OAC.  The visualization can also be filtered based on Classic dashboard prompts.

Below is an example of a Treemap visualization built in DV and is displayed on an OAC Classic Dashboard.


Below are the steps needed to build this simple dashboard page.

  1. Create the visualization in DV with no filters. Filters will cause issues if you are using Classic dashboard prompts. Save the visualization.


2. Create a new dashboard in Classic and add a Classic dashboard prompt and the visualization that you created in DV.  Be sure you select the canvas that you want to display.


    Once this is done, the dashboard is ready to go.   


3.  To test the filters, I opted to Select COMMERCIAL on Construction Type.  The DV data is now reflecting data for Task Suffix 0100 and Construction Type COMMERCIAL. 


An Important Note:  If you add canvases to the DV workbook, add them to the end.  Reordering the Canvas can impact what is displayed on the dashboard page.  In the screenshot below, I added a canvas to the DV workbook and moved it before the TreemapVis canvas.


When I go back to the dashboard that I created earlier, my List of Divisions canvas is displaying.


To fix this, edit the dashboard and change the view:


The dashboard is now displaying correctly: 


Good Luck and Happy Analytics! 


Connecting Power BI to OAC Subject Areas and Analyses

Last fall, Oracle worked with Microsoft to open OAC up to Power BI users and allow them connect to OAC data.  Currently, this can be done 3 ways:

  1. Pulling data from tables in an OAC Subject Area.
  2. Pasting in the logical SQL from OAC.
  3. Pulling data from an OAC Classic analysis (this capability came out in 2023)

This blog will cover what I experienced when installing and using the Power BI connection to OAC data.  

Installation:

Oracle has good documentation on connecting to Oracle Analytics from Power BI, https://docs.oracle.com/en/cloud/paas/analytics-cloud/acsds/connect-oracle-analytics-cloud-microsoft-powerbi.html  This provides a detailed step by step on getting it set up.  Things to note:

  •  OAC client tools, Model Administration, need to be installed on the users’ computers.  The Model Administration Tool allows users to edit the OAC Semantic model (RPD file).  You do not need access to modify the RPD they just the tool installed on their computer.

  • You will need to have the latest version of Power BI Desktop and Model Administration Tool installed. 

  • The document states you must download a .mez file and the documentation gives instructions to create folders in the c:\users\yourusername\documents. If you have a shared documents directory, like OneDrive,  you may need to put the file in that directory instead of the C-Drive. 
  •  Make sure you follow the instructions and you will need to exit and restart Power BI once you make the setting changes.  

Things to be aware when using Power BI:

  • You can only connect to OAC presentation subject areas (not the logical or physical layer) from Power BI Desktop.  

  • Power BI Pro and Premium are not supported.  

  • To access OAC, the user must have BIContentAuthor role privileges or higher in Oracle Analytics Cloud. Is this an issue?

  • When you log in using the App Key, you may get an error message. I only got it a couple of times at first, but I just needed to try again and then it worked.  I had the same issue with getting the list of subject areas to appear, sometimes I get an error message, but I refresh a few times and it will eventually come up. 
  • Pulling data from tables in an OAC Subject Area
    • In order to report OAC subject areas in Power BI, we will need to bring the unique IDs or WIDs to the presentation layer for the fact tables to join them to the dimension table in Power BI.  In OAC, we join them in the physical layer.  Since Power BI pulls data from the presentation layer the joins will not come along. If you want to bring over an ID or WID to the presentation layer and not have it appear to the users in OAC, you can edit the properties and fill out the Hide object if box with "1=1".   

        The ID will be visible in Power BI but not in OAC. 

    • The data is filtered once it is bought over to Power BI.  If you have a large table it will attempt to bring over the entire table and will error out on too many rows.    
  •  Pulling data Logical SQL
    • In order to report OAC subject areas in Power BI, we will need to bring the unique IDs or WIDs to the presentation layer for the fact tables to join them to the dimension table.
    • To access the logical SQL in OAC, go to the Advanced tab of the analysis and copy all the logical SQL Issued.


    • The logical  creates aliases for the column name.  The screenshot below show s_1 and s_2.  This can be changed once you load the data in PowerBI, but I find it easer to just remove the alias prior to pasting the logical SQL into PowerBI.
  • Pulling data OAC Classic Analysis
    • When you select an analysis, the logical SQL is produced and the column names that are pulled over are the alias names that are generated in the logical SQL, like the s_1 and s_2 above.  
Overall all, the documentation is provided is good and I have found that the connection works well as a alternative solution if your organization have users who are exporting data out of OAC into PowerBI.  

Wednesday, January 18, 2023

Cleaning Out Custom Calculations from OAC Workbook

When building visualizations in OAC, users take advantage of My Calculations to build custom calculations within the workbook.  Many of these custom calculations become obsolete for various reasons:
  • Newer versions of the original calculation are created.
  • Calculations are rebuilt in OAC subject area so they can be shared across multiple workbooks.
  • Calculations are pushed back to the ETL process for better report performance.
Having duplicate measures in a workbook can be confusing to the other users and possibly provide incorrect results on the visualization.  Below are a couple of steps to keep OAC workbooks as clean as possible.

Update Instead of Replace Calculations

Instead of making different versions of a calculation, change the existing calculation and add notes about the changes made. Use "/*" and "*/" to add comments to your calculation.  Besides reducing the number of calculations in a workbook, the new resulting values will automatically appear in the visualizations were the calculation is being used.  

Below is an screenshot example where changes were made to a calculation. Brown text are the comments and the blue text is the code.


Remove Calculations not Needed

Prior to moving a workbook into production or releasing to others, delete the calculations that are no longer used.  There are a couple of options:

Option 1:

Right click on the obsolete calculation and select Remove Calculation.  


This is the best option if there is only a few calculations to delete and you are confident they are not used in the workbook.  

The downside to this method is that each calculation must be deleted individually and  no warning is provided if the calculation is used in any of the visualizations.  This process removes the calculation from all visualizations throughout the workbook prior to deleting the calculation.  

Warning:  Don't use the computer Delete button to remove the calculations.  It will remove the calculations only while workbook is currently open.  Once the workbook is closed and reopened, the deleted calculations will reappear.  

Option 2:

Copy each of the canvases over to a clean workbook.  When you do this only the calculated measures being used in the visualizations will be copied. Below is an example with steps on how to accomplish this.

In the example we have a workbook with 18 calculations and 3 canvases.  See screen shot below.


Step 1:
Right click on the canvas and click on "Copy Canvas."


Step 2:
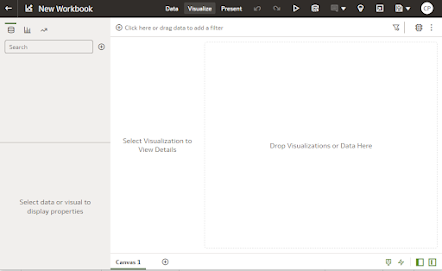
Open a new workbook in OAC.


Step 3:
Right click in the lower area to the right of Canvas 1.  "Paste Canvas" will appear.  Click on "Paste Canvas."


Once this step is completed, the new workbook will contain the visualizations and data needed to support the visualizations for the imported canvas.  The visualizations in the Weekly Canvas, that was just imported, doesn't have any custom calculations (My Calculations) so none of the calculations from the original workbook were imported. 


Step 4:
Repeat Step 1 and Step 3 for the remaining canvases.  When done, only the custom calculations needed to support the visualizations will be in new workbook.  In the screenshot below, only 4 of the original 18 calculations are in the new workbook. 


Step 5:
Delete the blank canvas (Canvas 1) and save your workbook.  

This option is best if there several calculations to delete or you are unsure if the calculation is used in any of the visualizations. This is a safe and efficient way to remove any calculations that are not currently being used in this workbook.  
 
I hope you have found this helpful and best of luck.


Visualization – Santa Style

I have worked for years on data visualization with organizations making sure that key metrics stood out for executives and decision makers. ...